Note
Click here to download the full example code
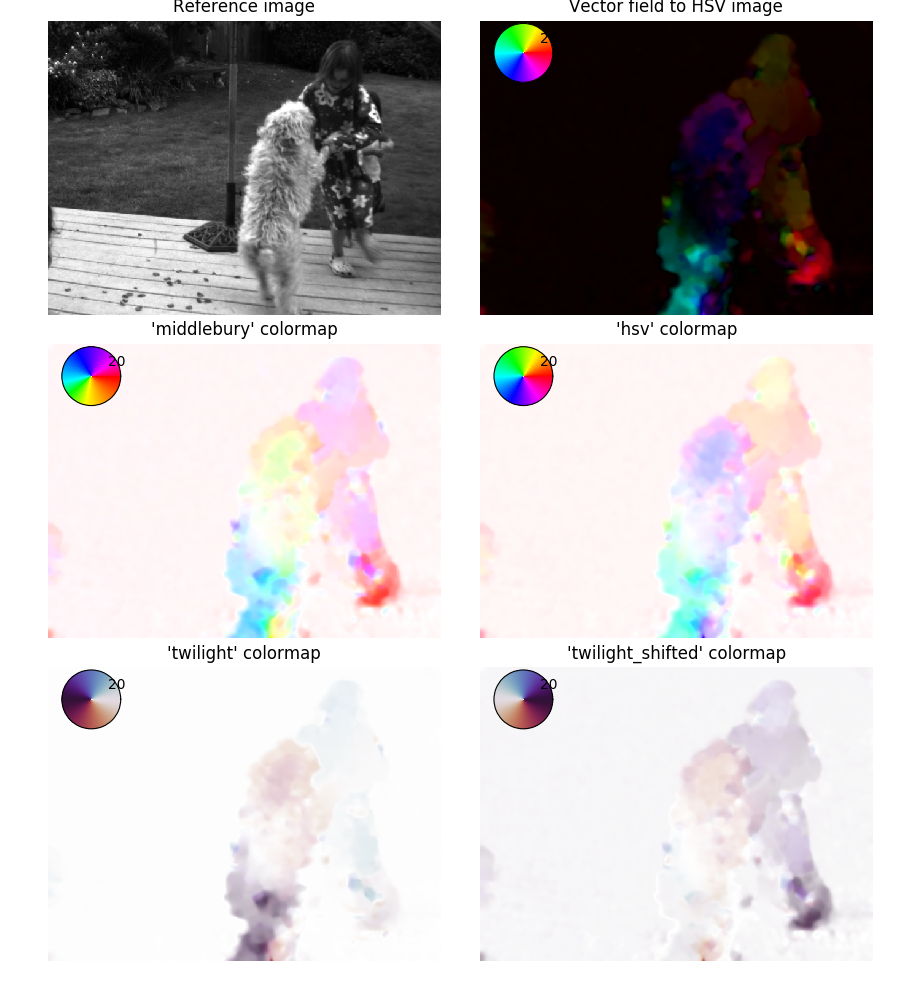
Vector field color coding
Demonstration of colormap application to a vector field.
Pyimof provides the pyimof.display.plot() that displays a color
mapping applyed to a dense vector field according to its orientation
and magnitude. Any circular colormap can be applyed. Matplotlib
provides some of them by default: hsv, twilight,
twilight_shifted, hsv_r, twilight_r,
twilight_shifted_r.
If no colormap is provided to the pyimof.display.plot()
function, the fector field color coding is made by constructing a HSV
image in which the hue is the orientation of the vector flow and the
value is its magnitude. The saturation is set to 1.
Pyimof defines the middlebury matplotlib colormap that is inspired
by the color coding introduced by the Middlebury optical flow
evaluation website for displaying algorithms results. Its reverse
version middlebury_r is also provided.
import matplotlib.pyplot as plt
import pyimof

# --- Load the Hydrangea sequence

I0, I1 = pyimof.data.dogdance()

# --- Estimate the optical flow

u, v = pyimof.solvers.ilk(I0, I1)

# --- Display it with different colormaps

fig = plt.figure(figsize=((9, 10)))
ax_arr = fig.subplots(3, 2, True, True)
fig.tight_layout()

ax0, ax1 = ax_arr[0, :]

ax0.imshow(I0, cmap='gray')
ax0.set_axis_off()
ax0.set_title("Reference image")

pyimof.display.plot(u, v, ax=ax1, cmap=None)
ax1.set_title("Vector field to HSV image")

cmap_list = ['middlebury', 'hsv', 'twilight', 'twilight_shifted']

for ax, cm in zip(ax_arr[1:, :].ravel(), cmap_list):
    pyimof.display.plot(u, v, ax=ax, cmap=cm)
    ax.set_title(f"'{cm}' colormap")

plt.show()
Total running time of the script: ( 0 minutes 3.931 seconds)
