Note
Click here to download the full example code
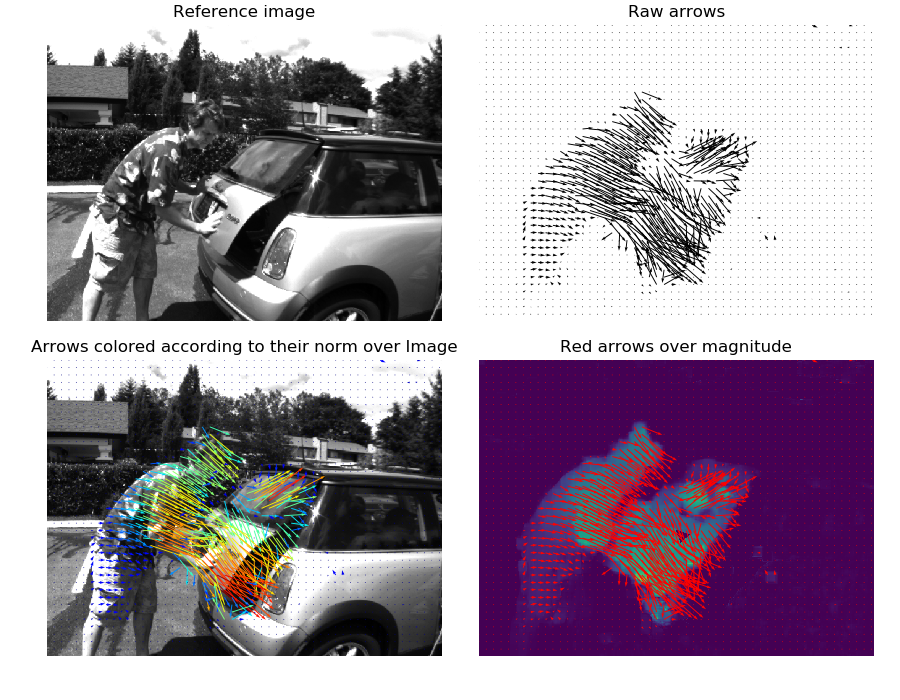
Vector field quiver plot
Demonstration of vector field quiver plot.
import numpy as np
import matplotlib.pyplot as plt
import pyimof

# --- Load the MiniCooper sequence

I0, I1 = pyimof.data.minicooper()

# --- Estimate the optical flow

u, v = pyimof.solvers.ilk(I0, I1)

norm = np.sqrt(u*u + v*v)

# --- Display it with different options

fig = plt.figure(figsize=((9, 7)))
ax0, ax1, ax2, ax3 = fig.subplots(2, 2, True, True).ravel()
fig.tight_layout()

ax0.imshow(I0, cmap='gray')
ax0.set_axis_off()
ax0.set_title("Reference image")

pyimof.display.quiver(u, v, ax=ax1)
ax1.set_title("Raw arrows")

pyimof.display.quiver(u, v, c=norm, bg=I0, ax=ax2,
                      cmap='jet', bg_cmap='gray')
ax2.set_title("Arrows colored according to their norm over Image")

pyimof.display.quiver(u, v, bg=norm, ax=ax3, color='r')
ax3.set_title("Red arrows over magnitude")

plt.show()
Total running time of the script: ( 0 minutes 1.070 seconds)
